Commonly used in Scrum teams, the burndown chart (sometimes referred to as a burn chart) serves as a tracking tool for monitoring the progress of Scrum teams’ work. Maintaining an up-to-date burndown chart can provide valuable insights into potential obstacles and help to address them swiftly.
While Scrum teams are well-acquainted with the practice of using burndown charts, this article is aimed at newcomers interested in exploring widely adopted Scrum practices. Let’s delve into the process of setting up a Burndown Chart.
Creating the Basic Burndown Chart Template
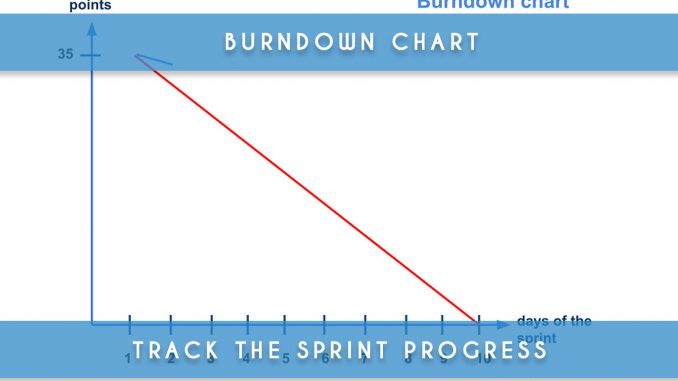
To initiate a Burndown Chart, begin by establishing a vertical axis representing the number of story points. Sum up the story points of all user stories planned for the current sprint (placed above).
| Tip: I highly recommend placing the total story points of sprint items that contribute to the sprint goal on your burndown chart. Not all items will align with the goal. |
Next, allocate the sprint’s working days along the horizontal axis. You can use either numbers or letters to represent each day, with the latter often being more reader-friendly.

With this foundation laid, plot the ideal trajectory to reach the sprint goal. It’s important to note that the vertical axis represents “remaining story points” rather than “Done” story points. Start at 35 at the beginning of the sprint and progress towards 0 at the sprint’s end.
A red linear line can then be drawn to represent the ideal progress trajectory of the sprint, as depicted below:

It’s important to acknowledge that the goal isn’t to strictly adhere to this line. The aim is to provide a reference point for tracking sprint progress. The Scrum Master can analyze the situation and identify solutions if any issues arise.
Once the template is prepared, updating the burndown chart for each sprint involves adjusting the axis values at the start of the sprint (using tools like Excel or Google Sheets). This avoids the need to recreate the entire chart every time.
Maintaining an Up-to-Date Burndown Chart
To keep the Burndown Chart current, I recommend displaying it visually (e.g., on a wall) and updating it daily.
For instance, consider our template: if a user story with 2 story points is completed on Tuesday, update the chart by plotting a blue curve that indicates a decrease of 2 story points, as shown:

Indeed, it’s a straightforward process.
By repeating this practice daily, you can maintain a clear view of the sprint’s progress.
However, even if the blue line appears above the red line, exercise caution before raising an alert. Following the ideal trajectory precisely isn’t feasible, as mentioned earlier. Context and project specifics can lead to various outcomes.
When the Burndown Chart’s Blue Line Rises
Occasionally, you might notice a rising line (within a day) on a Burndown Chart. The explanation is simple: the product owner introduced a new user story into the sprint.
If this new addition aligns with the sprint goal and is agreed upon by the development team, the line can rise.
However, if an additional user story isn’t linked to the goal, avoid adjusting the curve. Simply disregard this user story in the burndown chart. Consider marking it as an “IMPEDIMENT” to signify its disruption to the process.
As a Scrum Master, I advise adhering to this guideline, as it’s especially relevant when delays are observed. The blue tracking line should never rise without a valid reason. The burndown chart should reflect only the user stories committed to at the start of the sprint (or those directly contributing to the sprint goal).
Conclusion: The Burndown Chart
Familiar to Scrum teams, the burndown chart holds no secrets. Why not consider using a burndown chart within your teams?
For further insights, you can explore the burnup chart: Burnup Chart – Track the Progress
Useful link: Burndown Chart – How to Build It (French)


Be the first to comment