
Gantt Chart for Agile Methodology: Is It a Fit?
Do you wonder if the Gantt chart has a place in agile methodology? While this chart was widely used in the past, the agile community has embraced other concepts. Is this due to the Gantt Chart’s lack of agility or is it simply considered outdated?
If you have experience in project management using traditional methods like the V-model or waterfall, you’re likely familiar with the Gantt Chart. This chart was extensively used by teams to manage tasks and their interdependencies.
Defining the Gantt Chart for Agile Methodology
The Gantt chart visually tracks project progress while forecasting the overall project trajectory. It’s known for visually highlighting task interdependencies.
Certain software tools even facilitate resource distribution to automate task completion time estimation, going as far as accounting for leaves and illnesses.
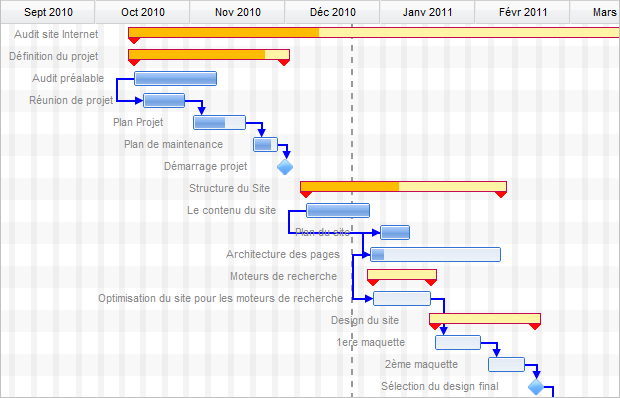
The Gantt chart presents tasks vertically and time horizontally, with arrows connecting tasks to signify that a task on the right cannot start until the task(s) on its left are completed. It resembles a staircase visually.
Here’s a typical Gantt chart representation:
However, even before discussing agility, the best tools on the market are comprehensive and incredibly efficient. But the question here is different: Is it a useful tool in an agile context?
Gantt Chart for Agile Methodology
The Gantt chart, especially when utilizing specialized tools, excels at forecasting. And with mastery of the top tools in the market, its construction is swift. However, if it doesn’t serve a purpose in your context, its usage becomes a waste of time.
Agile and Forecasting
Is forecasting relevant in Agile?
Agile contexts sometimes demand forecasting to address various elements:
- timely delivery
- communication needs
- …
Considering forecasting as nonexistent in agility is a misconception. Different situations necessitate forecasting. Despite operating autonomously, the product isn’t always detached from the context.
Examples include:
- compliance with laws
- readiness for a marketing campaign
- testing of expensive equipment
- startup investors’ expectations
Indeed, legal obligations cannot be ignored. In sectors like banking, flouting regulations is nearly unthinkable. Some scenarios demand non-negotiable periods. For instance, installing costly testing equipment in a hospital carries million-dollar expenses; postponing this phase isn’t viable due to financial constraints and potential service degradation.
In summary, certain situations aren’t straightforward, requiring agile to accommodate forecasting. However, can the Gantt chart fulfill this need?
What is Agile Forecasting?
In Agile, forecasting provides “an image” of potential product progress; it’s not a strict guide for teams. This differs significantly from traditional methods.
Teams are guided by the present:
- Scrum: based on short-term objectives
- Kanban: driven by a real-time influential vision
However, scenarios involving a “cut-off date” demand meticulous planning. Balancing variable and invariable aspects is essential. Assuming zero variability is a fallacy; this underscores the significance of working in small batches and prioritizing the backlog.
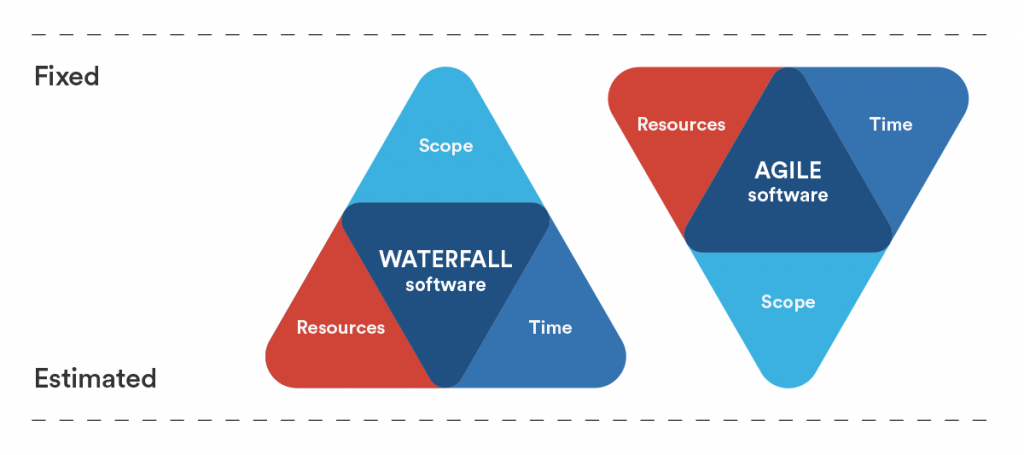
Agile focuses on a fixed cost and deadline but a variable scope. Nonetheless, Agile ideally minimizes reliance on costs and deadlines.
Can the Gantt Chart Fulfill This Need?
This is a complex question. I’ll shed light on the answer.
1. Creating a Gantt chart requires substantial effort and time investment. This is crucial since Agile advocates tool usage only when essential.
2. Establishing task interdependencies contradicts agility. This complicates the concept of a “dynamic backlog.” Here are key Agile concepts related to this topic:
- New tasks are consistently added to the backlog.
- User stories (a prevalent type of task) should be independent within an iteration.
- In Scrum, the Development Team helps choose realizations for the sprint during sprint planning.
Managing a Gantt chart incorporating these notions is complex. It would necessitate ongoing maintenance—feasible but potentially time-consuming. Calculating the ROI (Return on Investment) of its use is crucial.
Moreover, illustrating user story independence would result in displaying a task list.
Hence, there’s a significant likelihood that a Gantt chart isn’t suitable for Agile teams.
Conclusion: Gantt Chart for Agile Methodology
While the Gantt chart was a powerful tool for project progress management, it doesn’t align well with Agile practices. Alternative practices are more suitable, even though a notion of task links might be necessary.
For cases with non-negotiable timing, like complying with new laws, simplified displays are preferred to avoid cumbersome tools.
Useful link: Forecast Management with Agile Framing


Be the first to comment