
In Kanban, metrics play a crucial role in assessing the predictability, costs, throughput, and other essential elements of product development. However, navigating these metrics can sometimes be complex. In this article, we’ll explore some of the key Kanban metrics, what they mean, and how they can help you improve your product development process.
Calculate Lead Time
Lead time refers to the time it takes for a customer’s request to move from creation to being marked as “Done.” It’s a vital metric because it can reveal issues with the flow and handling of requests within your system.
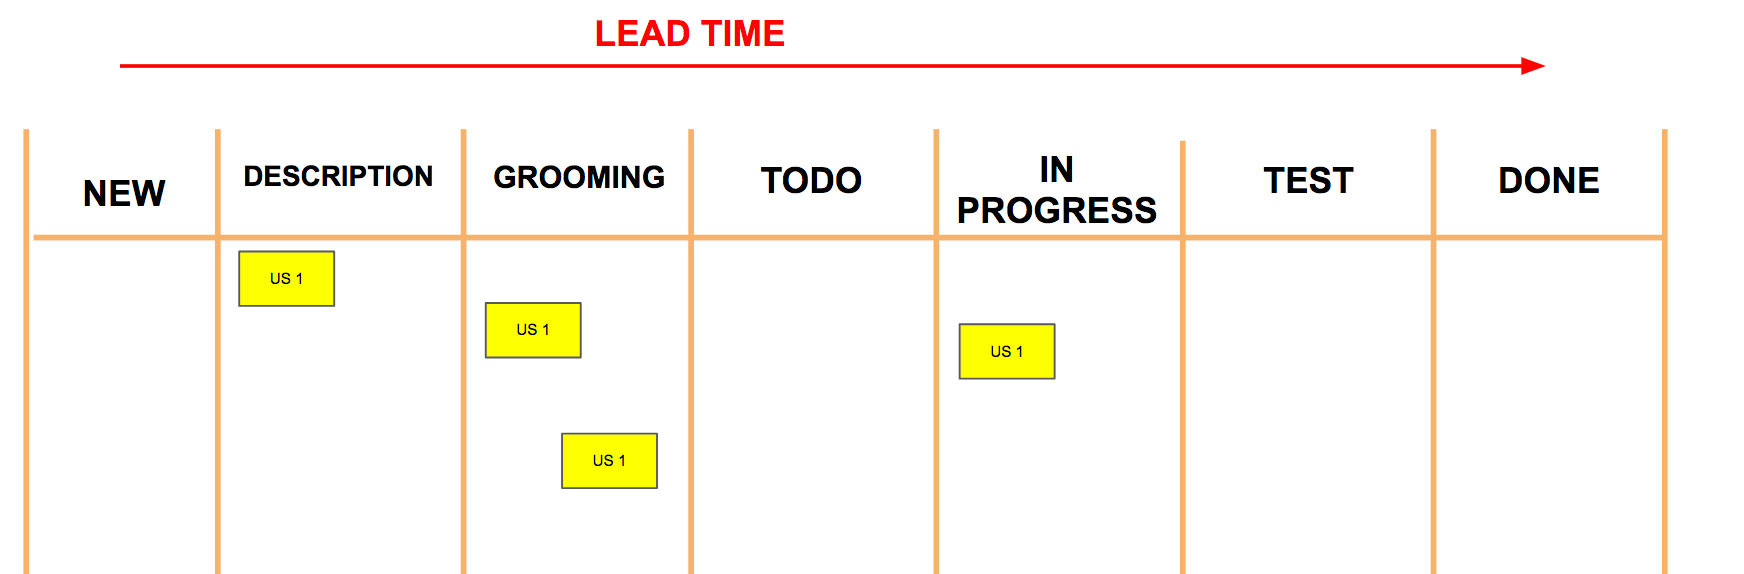
Calculate Cycle Time
Cycle time, on the other hand, is the number of days a request spends in the “work in progress” phase, moving from the “in progress” column to “done.” You can have different cycle times for specific phases to refine your metrics, such as the cycle time for requests maturing from “description” to “to-do.”
Utilize Throughput
Throughput measures the number of requests that reach the “Done” state. You can easily represent it by indicating the total number of requests completed each week, as shown below:
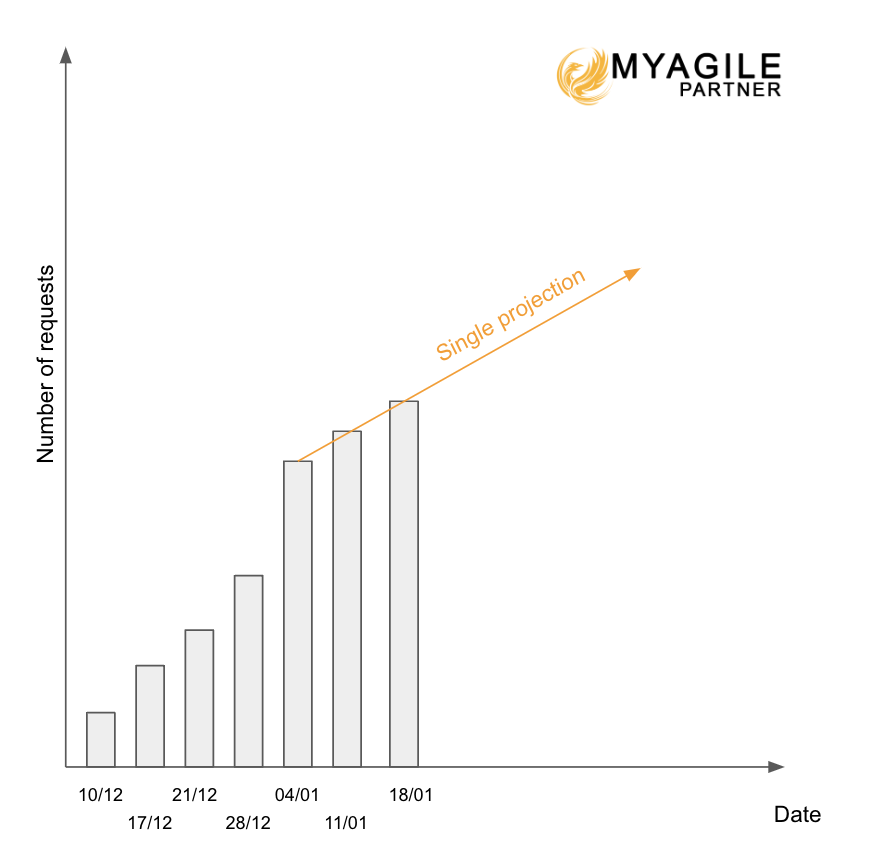
As seen in the chart, you can project future completed requests by considering the past three weeks. This method is commonly used to predict future throughput, as it accounts for potential changes in the team composition.
You can also perform a similar analysis by tracking the total effort points completed and forecasting based on that data.
Bugs Become a Problem
Using these metrics can quickly uncover serious issues over time. For instance, if the rate of bug processing keeps increasing, it might indicate a problem that requires attention. The graph below illustrates this:
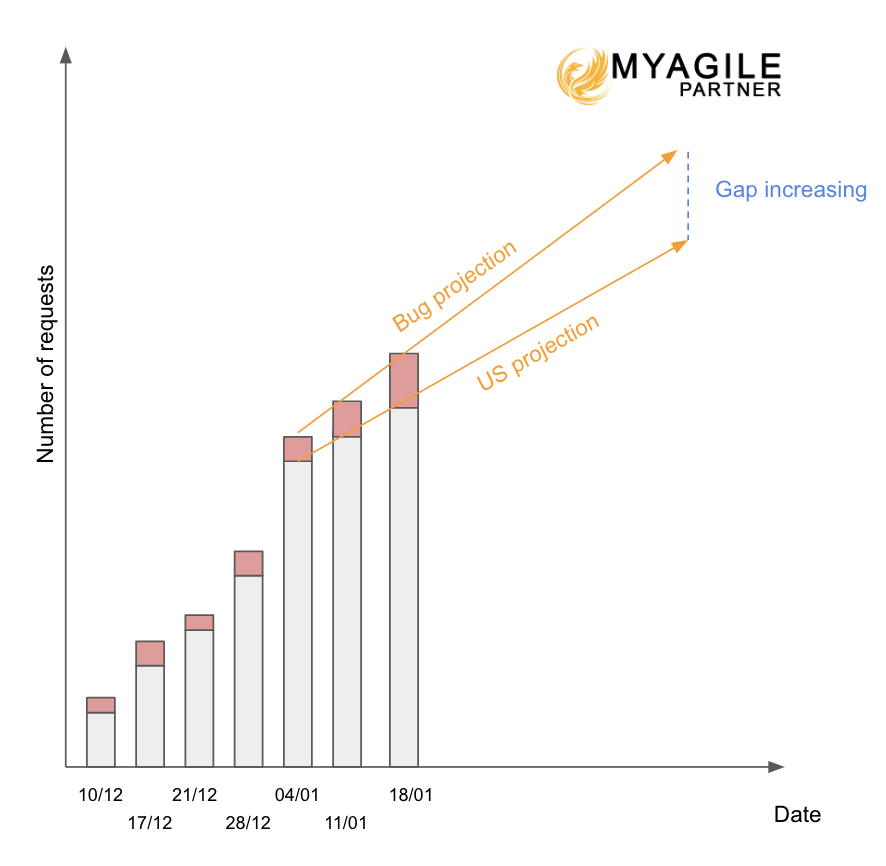
The graph shows a concerning increase in the bug rate, and if left unaddressed, it can lead to significant issues. Such problems may stem from inadequate unit testing or a lack of code quality and testing standards.
Cumulative Flow Diagram
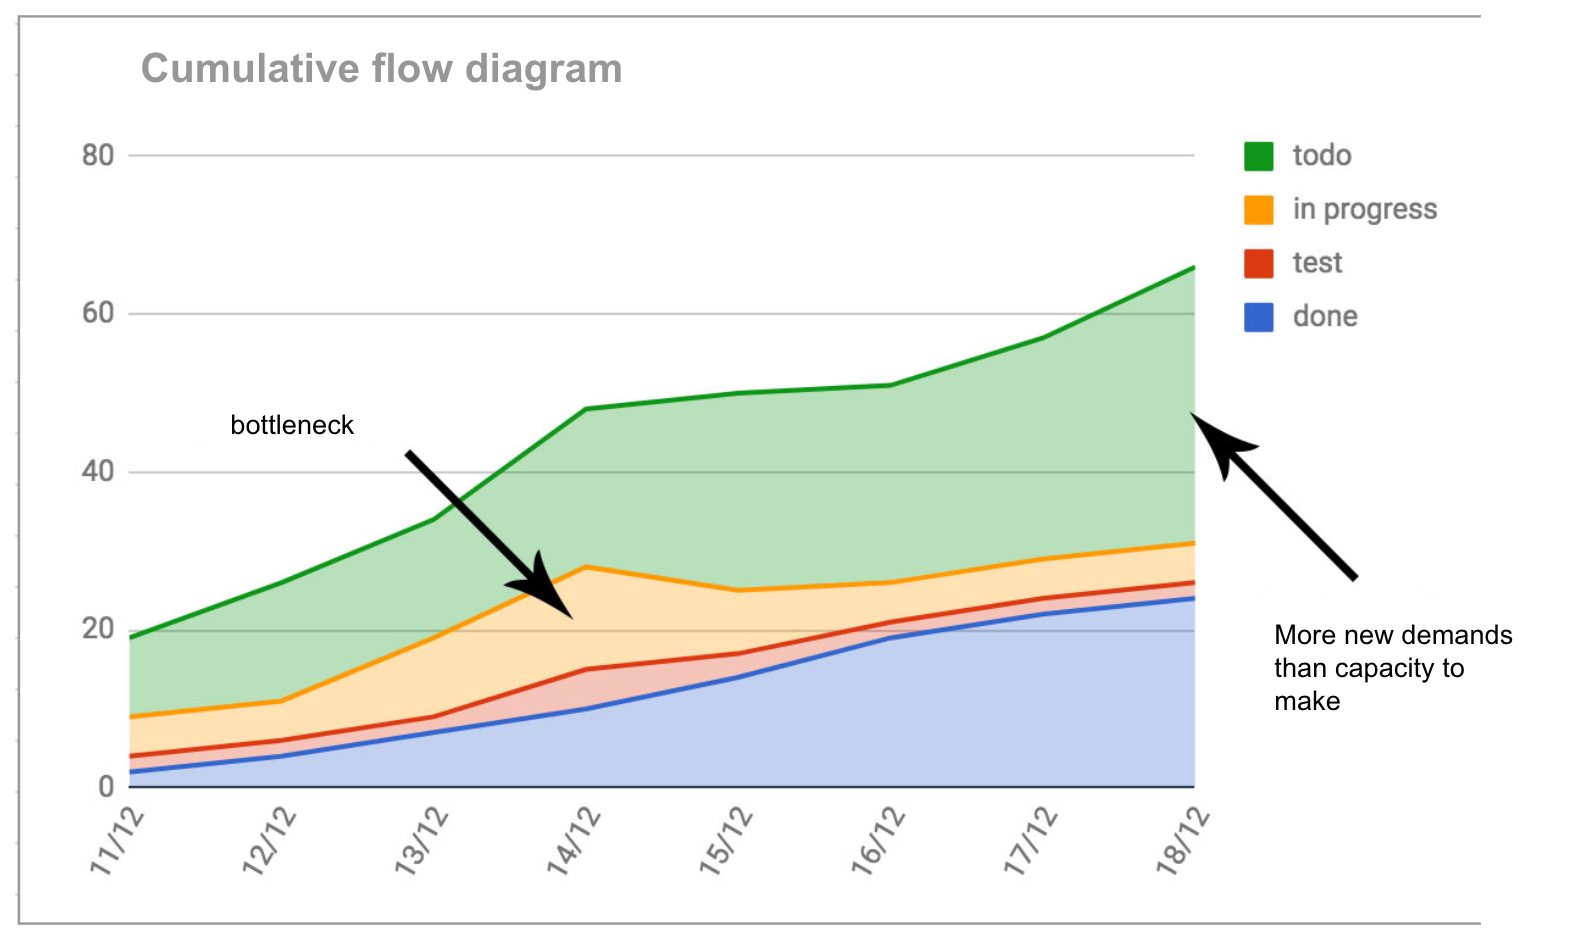
The Cumulative Flow Diagram (CFD) is a valuable tool for visualizing the number of requests in progress at each column on your Kanban board. It looks like this:
Identifying Bottlenecks
The CFD is particularly useful for identifying bottlenecks at various stages. For example, in the “in progress” column on December 14th, you can see that more requests were taken on than usual without finishing them. This behavior can be risky and needs analysis because it could lead to a large number of unfinished requests.
Addressing bottlenecks is crucial, and implementing solutions to regulate request flows is necessary to prevent an accumulation of unfinished work.
Growing Backlog
On the other hand, the CFD can also show a growing backlog over time, indicating that the current team is not adequately sized to handle all the incoming requests. The solution might not necessarily be to increase team size, which may not be feasible, but to enforce strict prioritization practices. Requesters will come to understand that some requests will never be fulfilled.
Cycle Time by Card (CTC) Diagram
The Cycle Time by Card (CTC) diagram adds an extra layer of rigor to request management. It involves creating a graph of the cycle time for each completed request to compare them.
If the cycle time for a request exceeds two times the standard deviation (calculated from all cycle times), it’s time to scrutinize the development of that specific request. Was the request too large, or were there interruptions during its development? It’s crucial to investigate and ensure that issues with each of these requests are thoroughly analyzed.
Here’s how to represent these Kanban metrics:
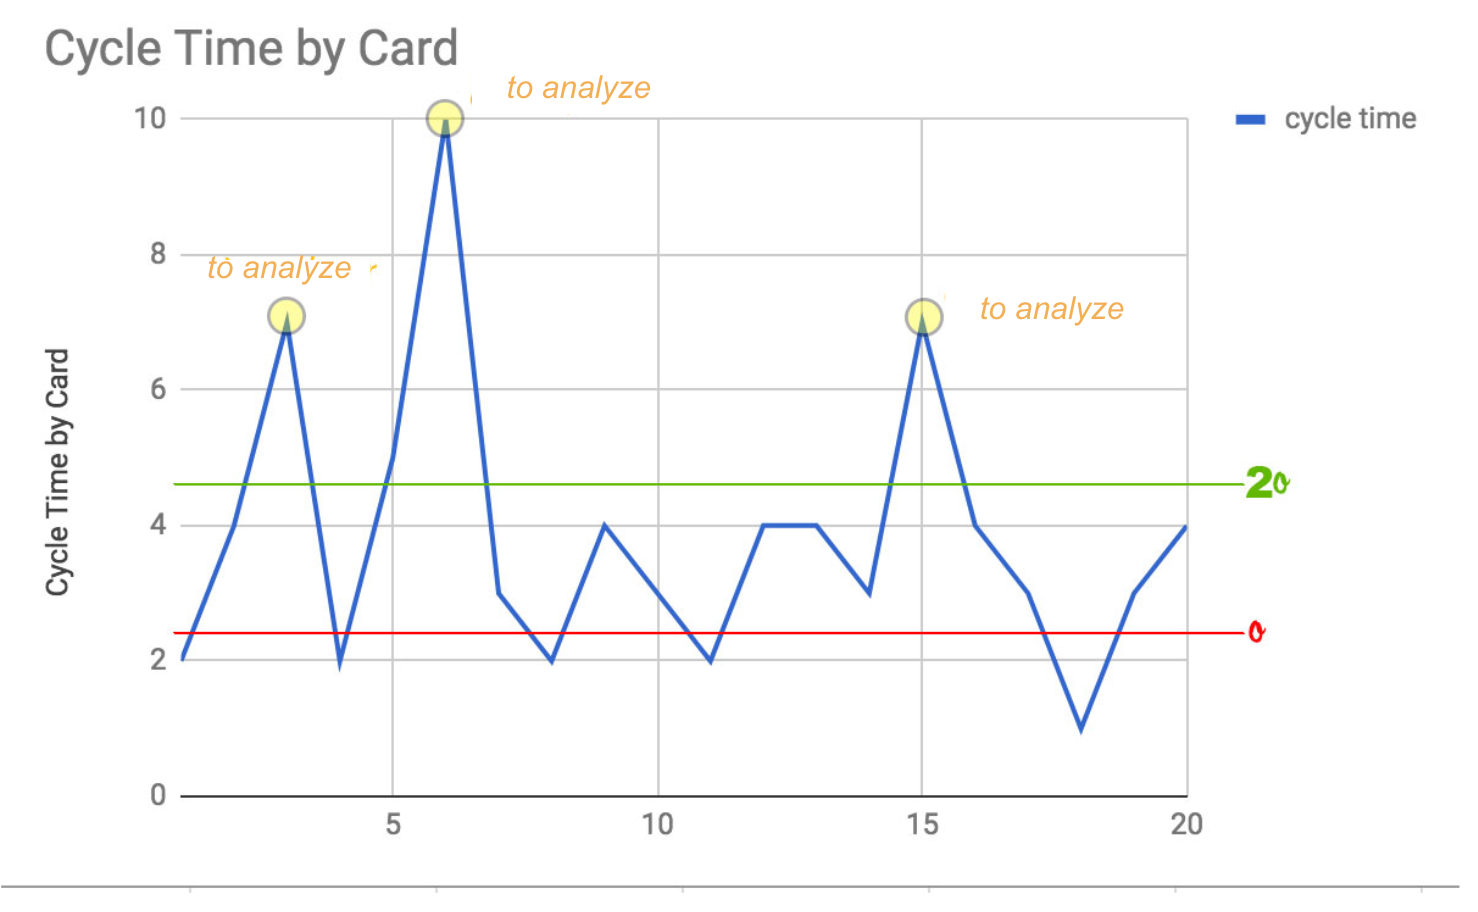
You can analyze this data in real-time to flag requests in “work in progress” that exceed twice the cycle time’s standard deviation for prompt action.
In Conclusion
While these are just a few of the Kanban metrics available, they can be invaluable for assessing and improving your product development process. Don’t hesitate to share your key metrics for evaluating the efficiency of your product development, and stay tuned for more insights into other Kanban metrics in the future.


Be the first to comment